Software
How Do You Get BI Dashboards To Frontline Teams?
Most organizations have great BI dashboards, but they live on a laptop, out of reach for frontline teams making real-time decisions. This article explains how digital signage closes that gap, letting Tableau, Power BI, Grafana, and Looker data reach the floor securely, plus how to plan and scale a rollout.
July 7, 2026
 ChatGPT
 Grok
Grok Perplexity
 Claude
Most organizations don't have a data problem. They have a visibility problem.
Companies invest heavily in business intelligence tools like Tableau, Power BI, Grafana, and Looker, and the dashboards they build are often genuinely excellent. But those dashboards tend to live in one place: a browser tab on someone's laptop.
Meanwhile, the people making minute-by-minute decisions (the ones on the factory floor, at the nurses' station, in the call center, or on the retail floor) rarely have a desktop in front of them at all.
If people can't see the data, they can't act on it. That gap between "the data exists" and "the right person can see it when it matters" is where organizations lose the most value from their BI investment.
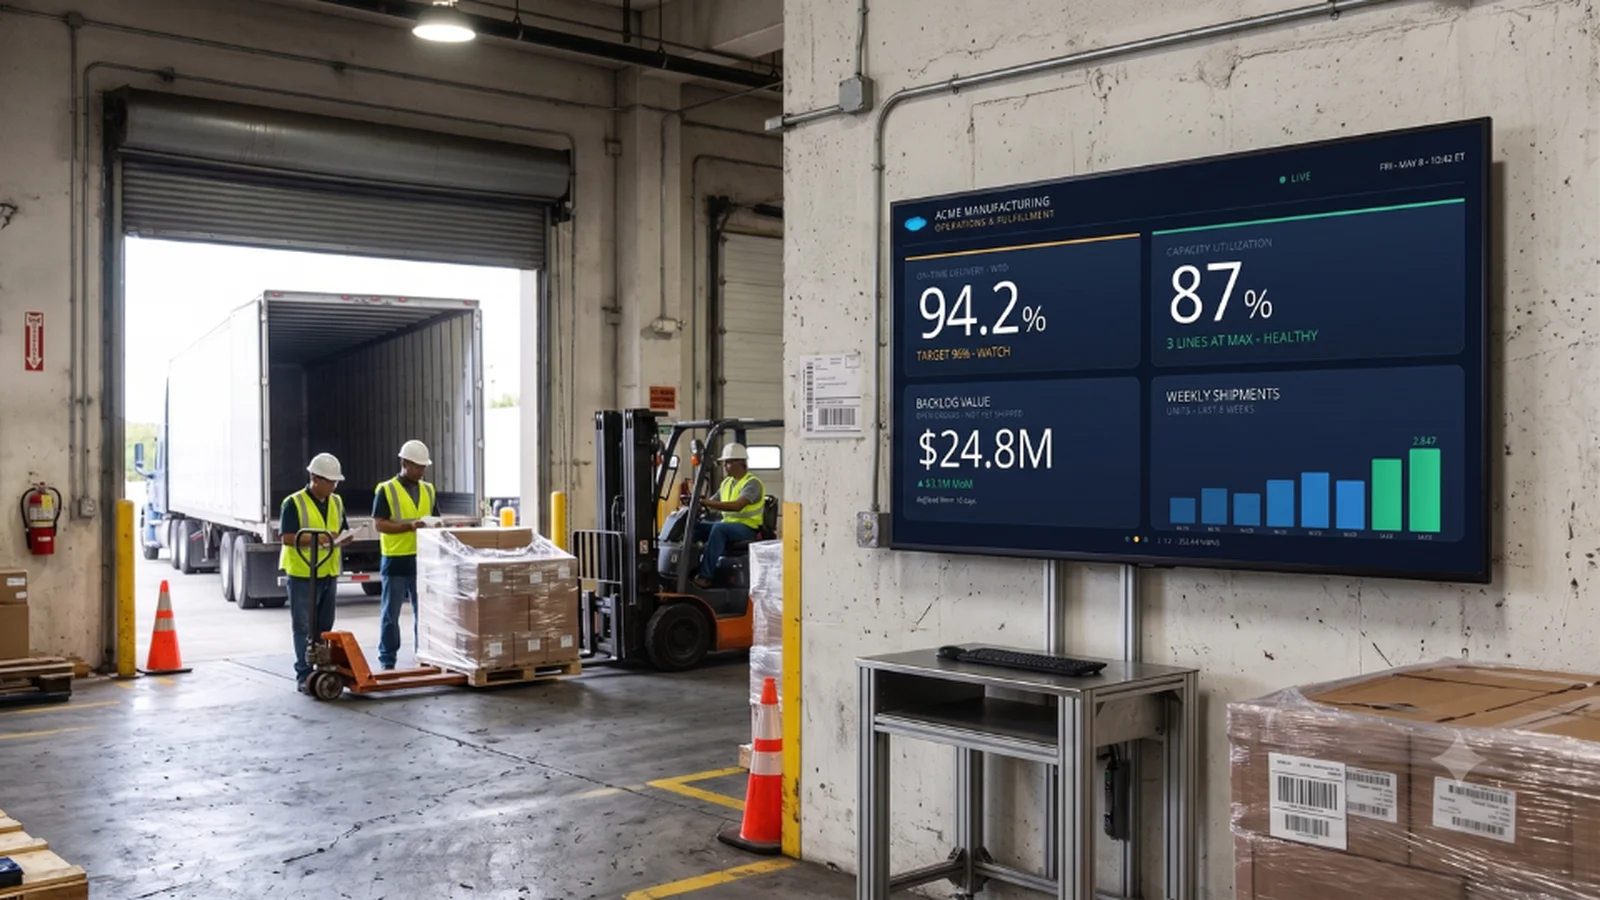
You get BI dashboards to frontline teams by displaying them directly on digital signage — connecting tools like Tableau, Power BI, Grafana, and Looker straight to screens on the factory floor, at the nurses' station, or wherever decisions actually happen, rather than leaving them behind a login on someone's laptop.
What happens when dashboards move from desktops to displays?
When BI data moves off the laptop and onto screens where teams actually work, the impact tends to be immediate and measurable. A few patterns show up again and again:
- Manufacturing floors see incident resolution time drop from hours to minutes when production metrics are visible in real time.
- Call centers make SLA performance and customer satisfaction scores visible to every agent, not just supervisors reviewing a report later.
- Healthcare facilities display patient flow and operational KPIs at the point of care, where staff can respond to changes as they happen.
The common thread isn't the industry. It's putting the right data in front of the right people at the right time.
How should you roll out BI dashboards on digital signage?
The most successful deployments start with a single, high-impact use case, then follow a simple four-step path: identify, deploy small, measure, and scale.
To find that starting point, ask:
- Where are decisions being made without real-time data?
- Who on the team doesn't have regular desktop access?
- Where would a faster response time — even ten minutes faster — make a measurable difference?
It's also worth remembering that designing for a wall isn't the same as designing for a laptop. A factory floor screen built for rapid response needs high granularity. A break room screen might focus on facility-wide metrics that build morale. A corporate lobby display is more about brand perception and high-level success metrics.
The audience and environment should shape what you show, not just the data you have available.
From there, the rollout itself follows the same general path across organizations:
- Identify the highest-impact area. Find the place where the absence of real-time data is costing the most: in time, errors, or missed opportunities.
- Deploy small. Start with a handful of screens in one location and get end users involved early.
- Measure the impact. Capture baseline metrics before and after to quantify the change.
- Scale with evidence. Use the early results (and the champions created along the way) to fund and support a broader rollout.
This pattern holds across industries. Manufacturing teams track production metrics. Healthcare organizations monitor patient flow. Retail locations keep an eye on sales and operations. Financial services teams track KPIs. Call centers watch service levels in real time. The dashboards look different everywhere, but the underlying challenge is the same: getting the right information to the right people, right when they need it.
How does Skykit actually display a BI dashboard on a screen?
Skykit renders each dashboard directly on the display itself, the same way it would appear in a browser, using a security-hardened version of Android's web view.
This is different from a lot of digital signage platforms, which rely on cloud-based screenshots of a dashboard — an approach that introduces two problems:
- The data is only as fresh as the last screenshot.
- On-premises dashboards, the kind running on a local network rather than the public internet, often can't be supported at all.
Skykit's direct-rendering approach means:
- Real-time updates appear as they happen, not on a screenshot delay.
- On-premises dashboards, including those running on internal or local network servers, are fully supported.
- Login sessions stay cached on the device, so once authenticated, the dashboard reconnects and refreshes in under a second rather than repeating a full login each time it rotates back into view.
🎥 Live Grafana login demo:
Skykit connects to more than 100 integrations, including 60+ dashboard and BI tools — Tableau, Power BI, Grafana, and Looker among them. We support standard logins, as well as SSO options like Okta, Google, ADFS, Microsoft 365, AWS (and more), with multi-factor authentication where required.
Skykit can also automatically clean up dashboard UI clutter after login, dismissing toolbars and filter panes so only the data itself remains on screen.
🎥 Power BI post-login cleanup:
Dashboards don't have to be the only thing on screen, either. The same displays can rotate BI data alongside other content, like:
- Company announcements
- Safety alerts
- Employee recognition
- Emergency notifications
This variety turns a single screen into a broader engagement tool, rather than a single-purpose data monitor, and gives teams more reasons to check it throughout the day.
Is digital signage safe for sensitive BI data?
Yes — displaying protected dashboard data on a screen is a fair thing to have questions about, and Skykit handles it with a few specific safeguards. Credentials are encrypted using Google Key Management, encrypted again in transit to the device, and never cached locally — they're used only for the login flow and then discarded.
Skykit also recommends connecting with a limited-privilege service account, scoped only to view the specific reports being displayed, rather than a full admin login. On top of that, Skykit maintains SOC 2 Type 2 compliance, reflecting an independently audited standard for how customer data is handled and protected.
🎥 Okta SSO + MFA login demo:
See your BI Dashboards on Skykit Digital Signage
If your organization has strong dashboards that aren't reaching the people who need them most, that's usually a sign the data itself is fine — it's the last step, getting it in front of frontline teams, that's missing. Skykit connects your existing BI tools directly to digital displays, with the security and reliability to keep that data flowing wherever your teams are working.
Included In This Story

Skykit
The Complete Digital Signage Platform
Skykit provides scalable and secure digital signage solutions to mid-size and large-scale enterprises, empowering them to transform spaces into dynamic hubs of communication and connection. From factories to hospitals to retail, Skykit makes digital signage accessible, intuitive, and impactful.
Related Media
Subscribe
Get the latest news and resources from Digital Signage Today.